顯示具有 spark 標籤的文章。 顯示所有文章

2016年5月20日 星期五

[PySpark] MLlib Regression example


[hadoop@master01 spark-1.6.0]$ cd /opt/spark-1.6.0/python/
[hadoop@master01 python]$ pyspark
Python 2.7.5 (default, Nov 20 2015, 02:00:19) 
[GCC 4.8.5 20150623 (Red Hat 4.8.5-4)] on linux2
Type "help", "copyright", "credits" or "license" for more information.
16/05/19 20:10:08 WARN NativeCodeLoader: Unable to load native-hadoop library for your platform... using builtin-java classes where applicable
Welcome to
____ __
/ __/__ ___ _____/ /__
_\ \/ _ \/ _ `/ __/ '_/
/__ / .__/\_,_/_/ /_/\_\ version 1.6.0
/_/

Using Python version 2.7.5 (default, Nov 20 2015 02:00:19)
SparkContext available as sc, HiveContext available as sqlContext.
>>> from pyspark.sql.types import *
>>> from pyspark.sql import Row
>>> rdd = sc.textFile('file:/opt/data/Sacramentorealestatetransactions.csv')
>>> rdd = rdd.map(lambda line: line.split(","))

Now now we can see that each line has been broken into Spark's RDD tuple format, which is what we want. However, we'll want to remove the header before we convert to a DataFrame since there's not a straightforward way (that I know of) to tell Spark to interpret that header as a list of column names.

>>> header = rdd.first()
>>> rdd = rdd.filter(lambda line:line != header)

Now we can see that the header has been removed.

>>> df = rdd.map(lambda line: Row(street = line[0], city = line[1], zip=line[2], beds=line[4], baths=line[5], sqft=line[6], price=line[9])).toDF()
16/05/19 20:11:04 WARN Connection: BoneCP specified but not present in CLASSPATH (or one of dependencies)
16/05/19 20:11:08 WARN ObjectStore: Version information not found in metastore. hive.metastore.schema.verification is not enabled so recording the schema version 1.2.0
16/05/19 20:11:08 WARN ObjectStore: Failed to get database default, returning NoSuchObjectException
16/05/19 20:11:10 WARN Connection: BoneCP specified but not present in CLASSPATH (or one of dependencies)
>>> 
>>> 
>>> 
>>> favorite_zip = df[df.zip == 95815]
>>> favorite_zip.show(5)
+-----+----+----------+------+----+----------------+-----+
|baths|beds| city| price|sqft| street| zip|
+-----+----+----------+------+----+----------------+-----+
| 1| 2|SACRAMENTO| 68880| 796| 2796 BRANCH ST|95815|
| 1| 2|SACRAMENTO| 69307| 852|2805 JANETTE WAY|95815|
| 1| 1|SACRAMENTO|106852| 871| 2930 LA ROSA RD|95815|
| 1| 2|SACRAMENTO| 78000| 800| 3132 CLAY ST|95815|
| 2| 4|SACRAMENTO| 89000|1316| 483 ARCADE BLVD|95815|
+-----+----+----------+------+----+----------------+-----+
only showing top 5 rows

>>> 
>>> 
>>> import pyspark.mllib
>>> import pyspark.mllib.regression
>>> from pyspark.mllib.regression import LabeledPoint
>>> from pyspark.sql.functions import *

Let's remove those rows that have suspicious 0 values for any of the features we want to use for prediction

>>> df = df.select('price','baths','beds','sqft')
>>> df = df[df.baths > 0]
>>> df = df[df.beds > 0]
>>> df = df[df.sqft > 0]
>>> df.describe(['baths','beds','price','sqft']).show()

+-------+------------------+------------------+------------------+------------------+
|summary| baths| beds| price| sqft|
+-------+------------------+------------------+------------------+------------------+
| count| 814| 814| 814| 814|
| mean|1.9606879606879606|3.2444717444717446| 229448.3697788698|1591.1461916461917|
| stddev|0.6698038253879438|0.8521372615281976|119825.57606009026| 663.8419297942894|
| min| 1| 1| 100000| 1000|
| max| 5| 8| 99000| 998|
+-------+------------------+------------------+------------------+------------------+

Labeled Points and Scaling Data


>>> 
>>> temp = df.map(lambda line:LabeledPoint(line[0],[line[1:]]))
>>> temp.take(5)
[LabeledPoint(59222.0, [1.0,2.0,836.0]), LabeledPoint(68212.0, [1.0,3.0,1167.0]), LabeledPoint(68880.0, [1.0,2.0,796.0]), LabeledPoint(69307.0, [1.0,2.0,852.0]), LabeledPoint(81900.0, [1.0,2.0,797.0])]
>>> 
>>> 
>>> 
>>> from pyspark.mllib.util import MLUtils
>>> from pyspark.mllib.linalg import Vectors
>>> from pyspark.mllib.feature import StandardScaler
>>> 
>>> features = df.map(lambda row: row[1:])
>>> features.take(5)
[(u'1', u'2', u'836'), (u'1', u'3', u'1167'), (u'1', u'2', u'796'), (u'1', u'2', u'852'), (u'1', u'2', u'797')]
>>> 
>>> 
>>> 
>>> standardizer = StandardScaler()
>>> model = standardizer.fit(features)
>>> features_transform = model.transform(features)
>>> 
>>> features_transform.take(5)
[DenseVector([1.493, 2.347, 1.2593]), DenseVector([1.493, 3.5206, 1.7579]), DenseVector([1.493, 2.347, 1.1991]), DenseVector([1.493, 2.347, 1.2834]), DenseVector([1.493, 2.347, 1.2006])]
>>> 
>>> 
>>> lab = df.map(lambda row: row[0])
>>> lab.take(5)
[u'59222', u'68212', u'68880', u'69307', u'81900']
>>> 
>>> transformedData = lab.zip(features_transform)
>>> transformedData.take(5)
[(u'59222', DenseVector([1.493, 2.347, 1.2593])), (u'68212', DenseVector([1.493, 3.5206, 1.7579])), (u'68880', DenseVector([1.493, 2.347, 1.1991])), (u'69307', DenseVector([1.493, 2.347, 1.2834])), (u'81900', DenseVector([1.493, 2.347, 1.2006]))]
>>> 
>>> 
>>> transformedData = transformedData.map(lambda row: LabeledPoint(row[0],[row[1]]))
>>> transformedData.take(5)
[LabeledPoint(59222.0, [1.49297445326,2.34703972035,1.25933593899]), LabeledPoint(68212.0, [1.49297445326,3.52055958053,1.7579486134]), LabeledPoint(68880.0, [1.49297445326,2.34703972035,1.19908063091]), LabeledPoint(69307.0, [1.49297445326,2.34703972035,1.28343806223]), LabeledPoint(81900.0, [1.49297445326,2.34703972035,1.20058701361])]
>>> 
>>> 
>>> trainingData, testingData = transformedData.randomSplit([.8,.2],seed=1234)
>>> from pyspark.mllib.regression import LinearRegressionWithSGD
>>> linearModel = LinearRegressionWithSGD.train(trainingData,1000,.2)
16/05/19 20:13:49 WARN BLAS: Failed to load implementation from: com.github.fommil.netlib.NativeSystemBLAS
16/05/19 20:13:49 WARN BLAS: Failed to load implementation from: com.github.fommil.netlib.NativeRefBLAS
>>> linearModel.weights
DenseVector([15098.627, 3792.023, 70216.8097])
>>> 
>>> 
>>> testingData.take(10)
[LabeledPoint(100309.0, [2.98594890652,3.52055958053,1.36930187625]), LabeledPoint(124100.0, [2.98594890652,3.52055958053,2.41171870613]), LabeledPoint(148750.0, [2.98594890652,4.69407944071,2.21739533756]), LabeledPoint(150000.0, [1.49297445326,1.17351986018,1.14485085363]), LabeledPoint(161500.0, [2.98594890652,4.69407944071,2.3906293483]), LabeledPoint(166357.0, [1.49297445326,4.69407944071,2.94497818269]), LabeledPoint(168000.0, [2.98594890652,3.52055958053,2.22492725107]), LabeledPoint(178480.0, [2.98594890652,3.52055958053,1.78506350204]), LabeledPoint(181872.0, [1.49297445326,3.52055958053,1.73535287287]), LabeledPoint(182587.0, [4.47892335978,4.69407944071,2.78831438167])]
>>> 
>>> 
>>> linearModel.predict([1.49297445326,3.52055958053,1.73535287287])
157742.84989605084
>>> 
>>> 
>>> from pyspark.mllib.evaluation import RegressionMetrics
>>> prediObserRDDin = trainingData.map(lambda row: (float(linearModel.predict(row.features[0])),row.label))
>>> metrics = RegressionMetrics(prediObserRDDin)
>>> 
>>> 
>>> metrics.r2
0.4969184679643588 
>>> 
>>> 
>>> prediObserRDDout = testingData.map(lambda row: (float(linearModel.predict(row.features[0])),row.label))
>>> metrics = RegressionMetrics(prediObserRDDout)
>>> 
>>> 
>>> etrics.rootMeanSquaredError
Traceback (most recent call last):
File "<stdin>", line 1, in <module>
NameError: name 'etrics' is not defined
>>> metrics.rootMeanSquaredError
94895.10434498572


[Reference]
http://www.techpoweredmath.com/spark-dataframes-mllib-tutorial/

2016年5月9日 星期一

[Spark] Collaborative Filtering, alternating least squares (ALS) practice


Collaborative Filtering - spark.mllib
http://spark.apache.org/docs/latest/mllib-collaborative-filtering.html#collaborative-filtering

In the following example we load rating data. Each row consists of a user, a product and a rating. We use the default ALS.train() method which assumes ratings are explicit. We evaluate the recommendation model by measuring the Mean Squared Error of rating prediction.


Result :
Mean Squared Error = 5.491294660658085E-6


-------------------------------------------------------------------------------------------------------

ERROR : taskSchedulerImpl: Initial job has not accepted any resources
http://www.datastax.com/dev/blog/common-spark-troubleshooting


-------------------------------------------------------------------------------------------------------

ALS
http://spark.apache.org/docs/latest/api/scala/index.html#org.apache.spark.mllib.recommendation.ALS$

ALS.scala
https://github.com/apache/spark/blob/v1.6.1/mllib/src/main/scala/org/apache/spark/mllib/recommendation/ALS.scala

Movie Recommendations with MLlib
https://databricks-training.s3.amazonaws.com/movie-recommendation-with-mllib.html

Dataset - MovieLens 1M Dataset
http://grouplens.org/datasets/movielens/


2015年5月17日 星期日

Cluster監控的tool (持續更新中)


Sematext - SPM

我覺得它的UI非常好看,但是要收費


ambari包含了Ganglia & Nagios

Installing a Hadoop Cluster with three Commands

Ambari (the graphical monitoring and management environment for Hadoop)


ambari安裝經驗分享


使用Ambari快速部署Hadoop大数据环境

http://www.cnblogs.com/scotoma/archive/2013/05/18/3085248.html

Ganglia介紹

http://www.ascc.sinica.edu.tw/iascc/articals.php?_section=2.4&_op=?articalID:5134


RPi-Monitor


專門監控Raspberry Pi

  • CPU Loads
  • Network
  • Disk Boot
  • Disk Root
  • Swap
  • Memory
  • Uptime
  • Temperature


2015/05/17

我要尋找監控Hadoop和Spark效能以及cluster功率消耗的tool
目前還沒找到最理想的解決方法 

2015年5月4日 星期一

[Spark] Word count 練習

先到spark資料夾
cd /opt/spark/

開啟spark-shell
sbin/start-all.sh

開啟spark-shell
bin/spark-shell


建立path到我們要讀的檔案
val path = "/in/123.txt"

把檔案讀進去,sc是SparkContext的縮寫
val file = sc.textFile(path)

file變成了一個RDD,要用collect指令看RDD裡的東西
file.collect


val line1 = file.flatMap(_.split(" "))

line1.collect

val line2 = line1.filter(_ != "")

line2.collect

val line3 = line2.map(s=> (s,1))

line3.collect

val line4 = line3.reduceByKey(_ + _)

line4.collect

line4.take(10)

line4.take(10).foreach(println)


官網一行指令

val wordCounts = file.flatMap(line => line.split(" ")).map(word => (word, 1)).reduceByKey((a, b) => a + b)

wordCounts.collect()


來看看執行狀況
http://[node IP]:4040/jobs/


[參考資料]

https://spark.apache.org/docs/latest/quick-start.html

http://kurthung1224.pixnet.net/blog/post/275207950


2015年4月6日 星期一

[Spark] 在Ubuntu-14.04上安裝Spark

我在VirtualBox上實做參考的文章,寫得很詳細


Install Apache Spark on Ubuntu-14.04


Building and running Spark 1.0 on Ubuntu


sbt/sbt assembly
在執行此指令時,發生了一些問題
java.io.IOException - Cannot run program "git": java.io.IOException: error=2

解決方式為退出,並且安裝git
apt-get install git

參考
https://confluence.atlassian.com/pages/viewpage.action?pageId=297672065

2015年3月29日 星期日

[Paper Note] 正在讀Spark相關的paper

正在讀Spark偏系統面的paper


Spark-based anomaly detection over multi-source VMware performance data in real-time


Solaimani, M. ; Dept. of Comput. Sci., Univ. of Texas at Dallas, Richardson, TX, USA ; Iftekhar, M. ; Khan, L. ; Thuraisingham, B. 
more authors

Anomaly detection refers to identifying the patterns in data that deviate from expected behavior. These non-conforming patterns are often termed as outliers, malwares, anomalies or exceptions in different application domains. This paper presents a novel, generic real-time distributed anomaly detection framework for multi-source stream data. As a case study, we have decided to detect anomaly for multi-source VMware-based cloud data center. The framework monitors VMware performance stream data (e.g., CPU load, memory usage, etc.) continuously. It collects these data simultaneously from all the VMwares connected to the network. It notifies the resource manager to reschedule its resources dynamically when it identifies any abnormal behavior of its collected data. We have used Apache Spark, a distributed framework for processing performance stream data and making prediction without any delay. Spark is chosen over a traditional distributed framework (e.g.,Hadoop and MapReduce, Mahout, etc.) that is not ideal for stream data processing. We have implemented a flat incremental clustering algorithm to model the benign characteristics in our distributed Spark based framework. We have compared the average processing latency of a tuple during clustering and prediction in Spark with Storm, another distributed framework for stream data processing. We experimentally find that Spark processes a tuple much quicker than Storm on average.

Published in:

Computational Intelligence in Cyber Security (CICS), 2014 IEEE Symposium on

Date of Conference:

9-12 Dec. 2014


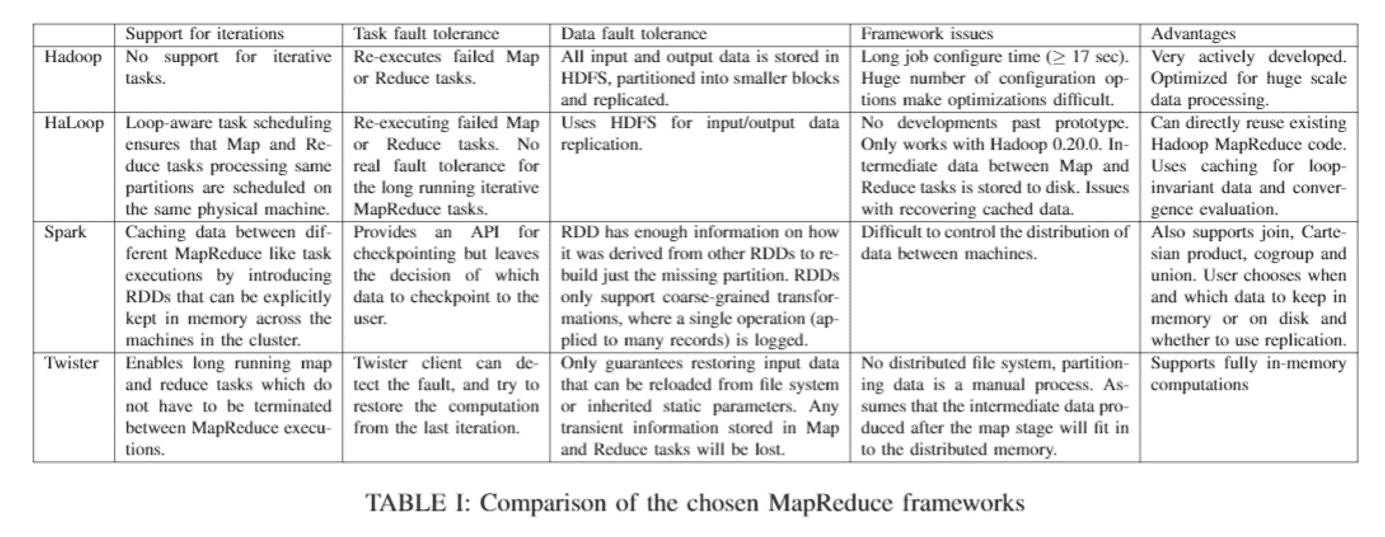
Evaluating MapReduce frameworks for iterative Scientific Computing applications

http://ieeexplore.ieee.org/xpl/articleDetails.jsp?tp=&arnumber=6903690&searchWithin%3Dhadoop%26refinements%3D4291944246%2C4291944822%26sortType%3Ddesc_p_Citation_Count%26ranges%3D2012_2015_p_Publication_Year%26queryText%3DSPARK

Jakovits, P. ; Inst. of Comput. Sci., Univ. of Tartu, Tartu, Estonia ; Srirama, S.N.


Scientific Computing deals with solving complex scientific problems by applying resource-hungry computer simulation and modeling tasks on-top of supercomputers, grids and clusters. Typical scientific computing applications can take months to create and debug when applying de facto parallelization solutions like Message Passing Interface (MPI), in which the bulk of the parallelization details have to be handled by the users. Frameworks based on the MapReduce model, like Hadoop, can greatly simplify creating distributed applications by handling most of the parallelization and fault recovery details automatically for the user. However, Hadoop is strictly designed for simple, embarrassingly parallel algorithms and is not suitable for complex and especially iterative algorithms often used in scientific computing. The goal of this work is to analyze alternative MapReduce frameworks to evaluate how well they suit for solving resource hungry scientific computing problems in comparison to the assumed worst (Hadoop MapReduce) and best case (MPI) implementations for iterative algorithms.

Published in:

High Performance Computing & Simulation (HPCS), 2014 International Conference on

Date of Conference:

21-25 July 2014


Understanding the behavior of in-memory computing workloads

http://ieeexplore.ieee.org/xpl/articleDetails.jsp?tp=&arnumber=6983036&searchWithin%3Dhadoop%26refinements%3D4291944246%2C4291944822%26sortType%3Ddesc_p_Citation_Count%26ranges%3D2012_2015_p_Publication_Year%26queryText%3DSPARK

Tao Jiang ; SKL Comput. Archit., ICT, Beijing, China ; Qianlong Zhang ; Rui Hou ; Lin Chai 
more authors

The increasing demands of big data applications have led researchers and practitioners to turn to in-memory computing to speed processing. For instance, the Apache Spark framework stores intermediate results in memory to deliver good performance on iterative machine learning and interactive data analysis tasks. To the best of our knowledge, though, little work has been done to understand Spark's architectural and microarchitectural behaviors. Furthermore, although conventional commodity processors have been well optimized for traditional desktops and HPC, their effectiveness for Spark workloads remains to be studied. To shed some light on the effectiveness of conventional generalpurpose processors on Spark workloads, we study their behavior in comparison to those of Hadoop, CloudSuite, SPEC CPU2006, TPC-C, and DesktopCloud. We evaluate the benchmarks on a 17-node Xeon cluster. Our performance results reveal that Spark workloads have significantly different characteristics from Hadoop and traditional HPC benchmarks. At the system level, Spark workloads have good memory bandwidth utilization (up to 50%), stable memory accesses, and high disk IO request frequency (200 per second). At the microarchitectural level, the cache and TLB are effective for Spark workloads, but the L2 cache miss rate is high. We hope this work yields insights for chip and datacenter system designers.

Published in:

Workload Characterization (IISWC), 2014 IEEE International Symposium on

Date of Conference:

26-28 Oct. 2014


A Big Data Architecture for Large Scale Security Monitoring

Marchal, S. ; SnT, Univ. of Luxembourg, Luxembourg, Luxembourg ; Xiuyan Jiang ; State, R. ; Engel, T.


Network traffic is a rich source of information for security monitoring. However the increasing volume of data to treat raises issues, rendering holistic analysis of network traffic difficult. In this paper we propose a solution to cope with the tremendous amount of data to analyse for security monitoring perspectives. We introduce an architecture dedicated to security monitoring of local enterprise networks. The application domain of such a system is mainly network intrusion detection and prevention, but can be used as well for forensic analysis. This architecture integrates two systems, one dedicated to scalable distributed data storage and management and the other dedicated to data exploitation. DNS data, NetFlow records, HTTP traffic and honeypot data are mined and correlated in a distributed system that leverages state of the art big data solution. Data correlation schemes are proposed and their performance are evaluated against several well-known big data framework including Hadoop and Spark.

Published in:

Big Data (BigData Congress), 2014 IEEE International Congress on

Date of Conference:

June 27 2014-July 2 2014